Fundamentals
Workspaces
Your Equals workspace is home to all the workbooks, datasources, queries, and views created by its members. By enabling Auto-join workspace under Settings > Workspace, you can ensure that users with email addresses from the same domain are automatically added to your workspace upon account creation. For more on workspace settings and configuration, visit our workspace setup guide.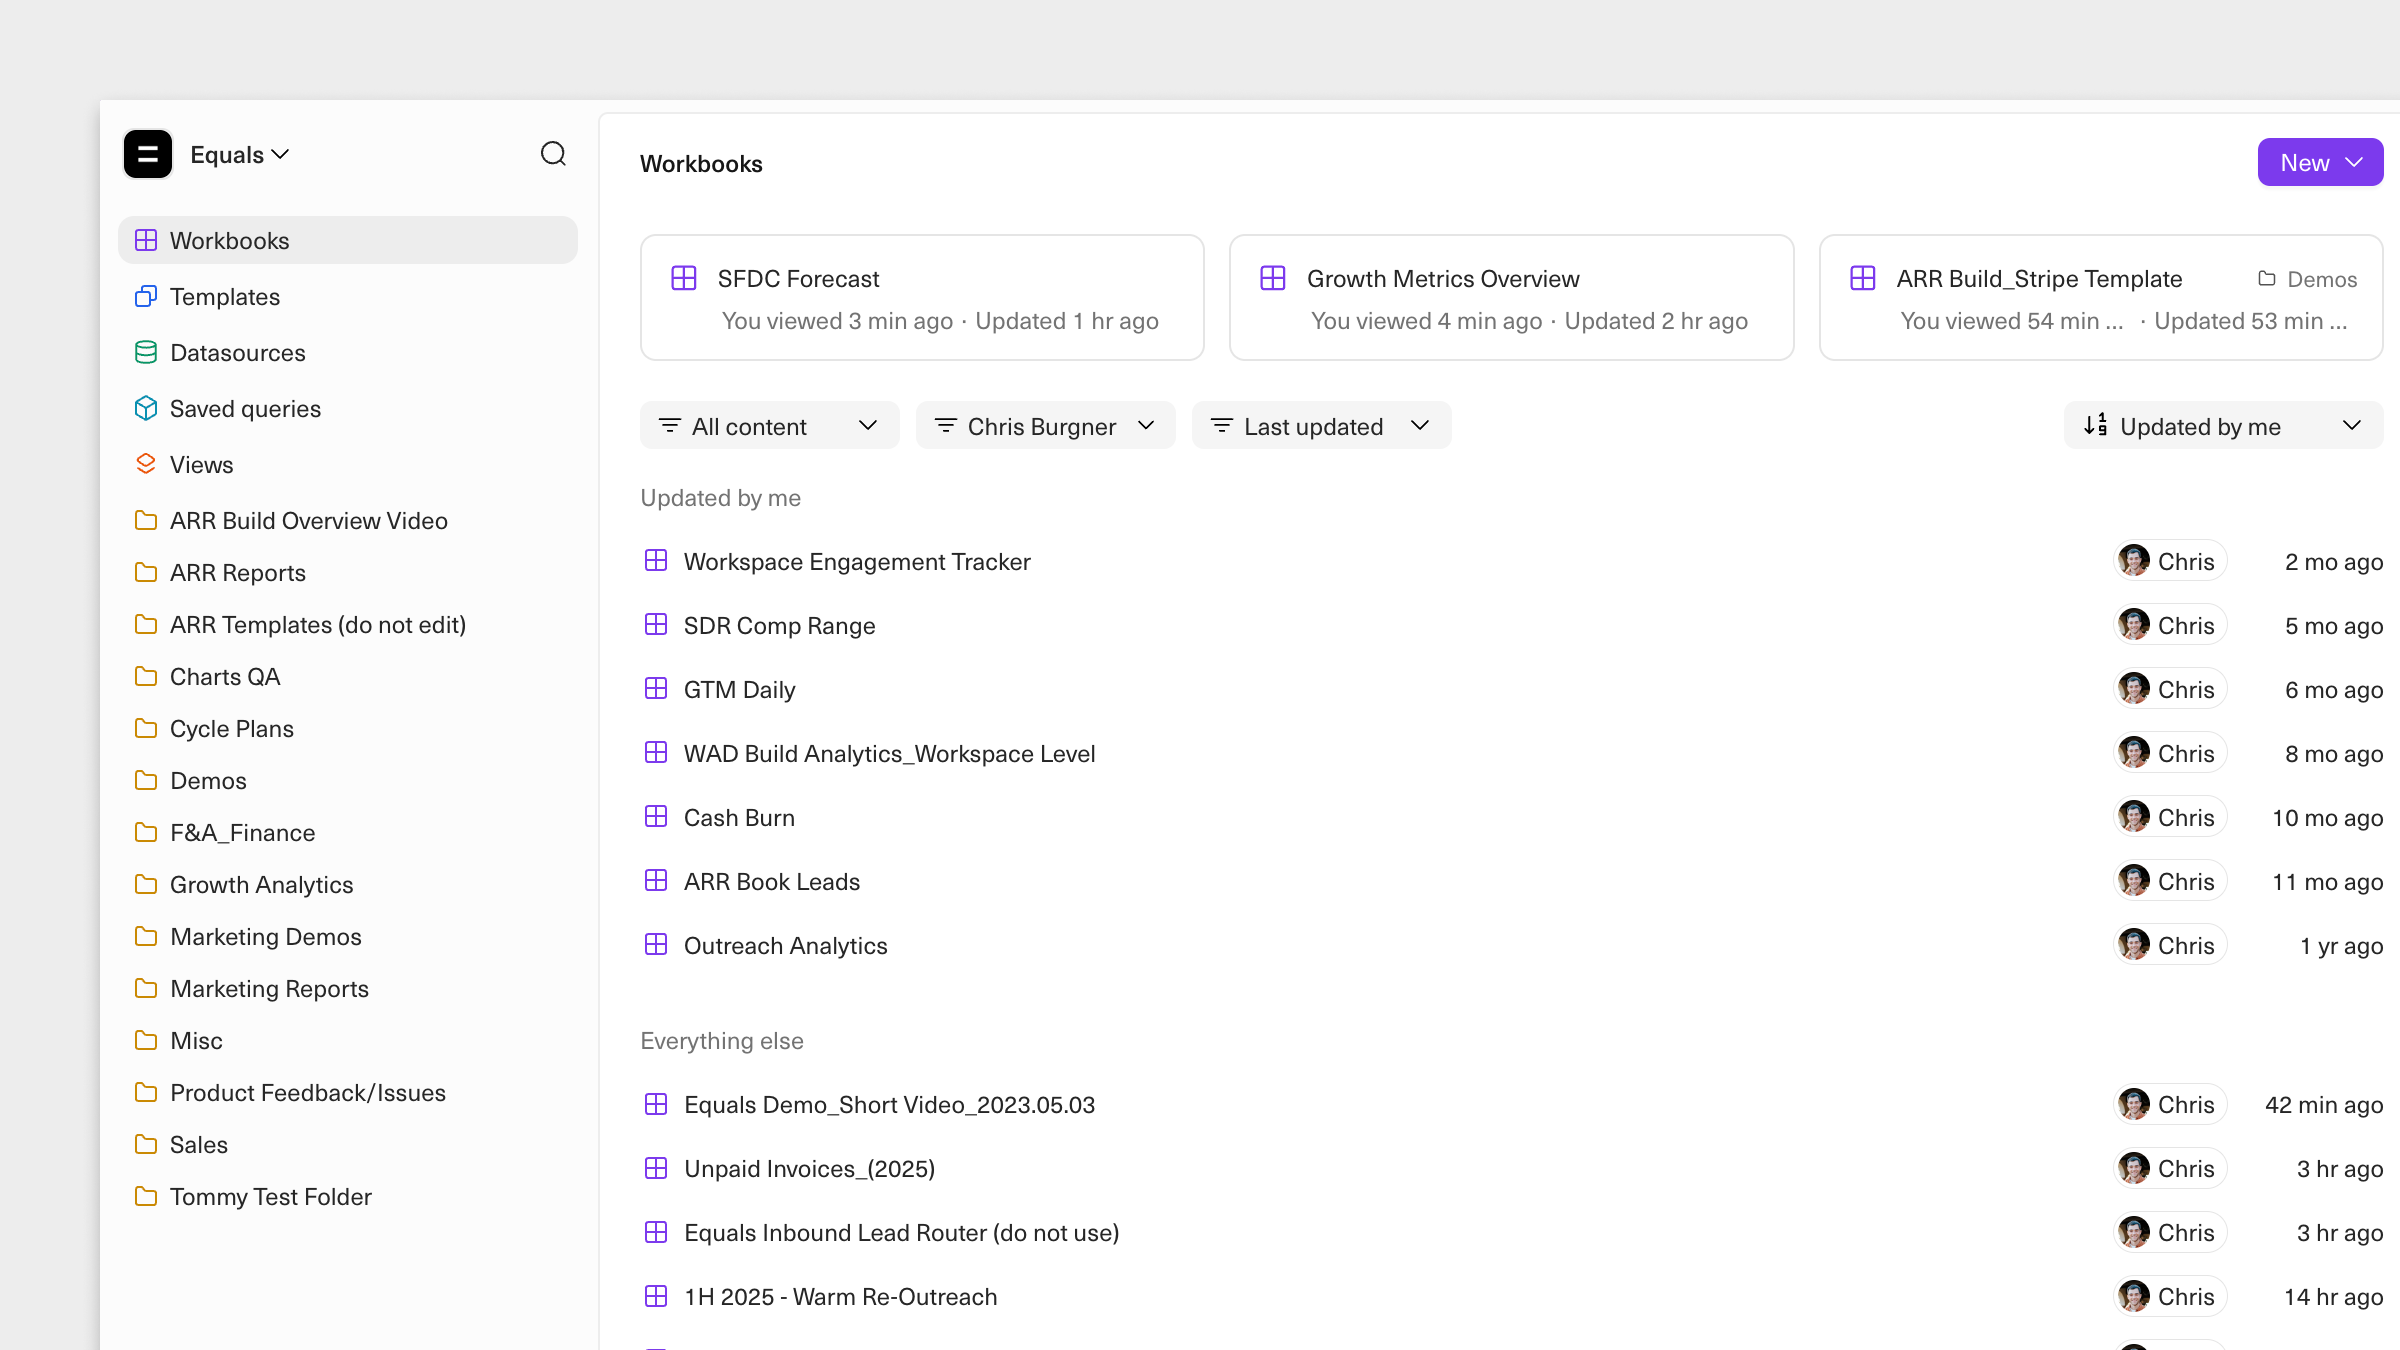
Datasources
Equals connects directly to your databases, data warehouses, and frequently used apps. Datasource connections are configured at the workspace level. View all available datasources by going to Datasources from your workspace home screen. To add a new datasource, click the New datasource button on the top right corner of the page and follow the provided instructions (or check out our configuration guides). Datasource connections can be shared with everyone in your workspace or with individual members.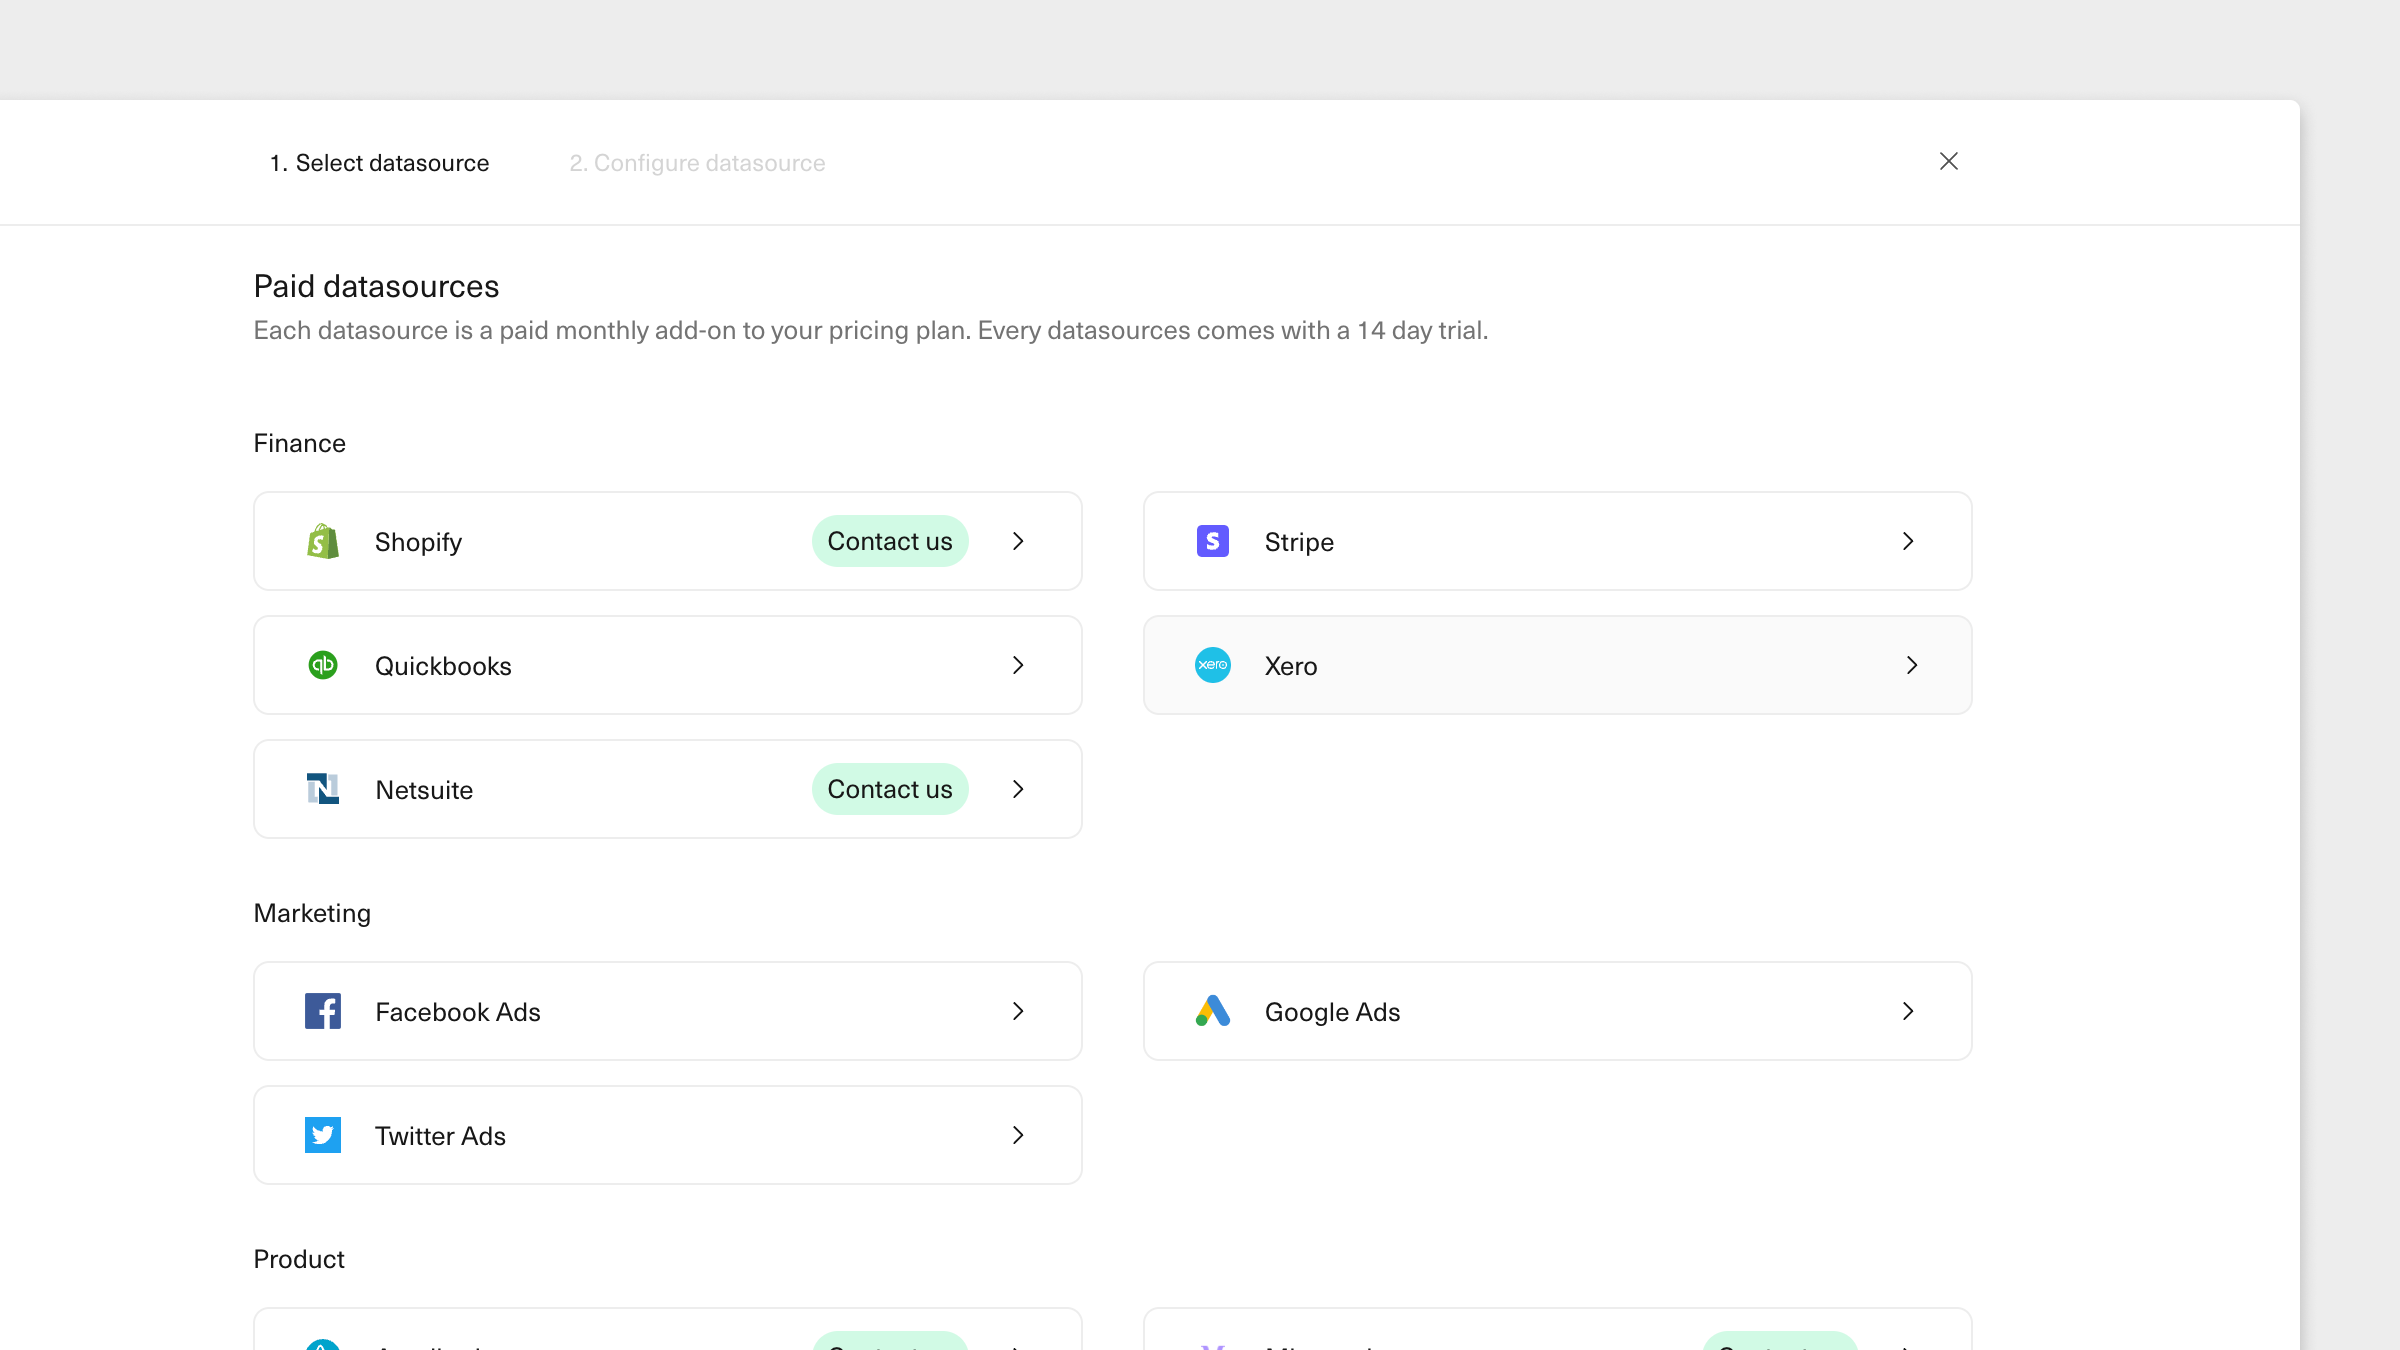
Equals Warehouse
When you connect more than one supported datasource to your Equals workspace, we automatically sync that data to your Equals Warehouse.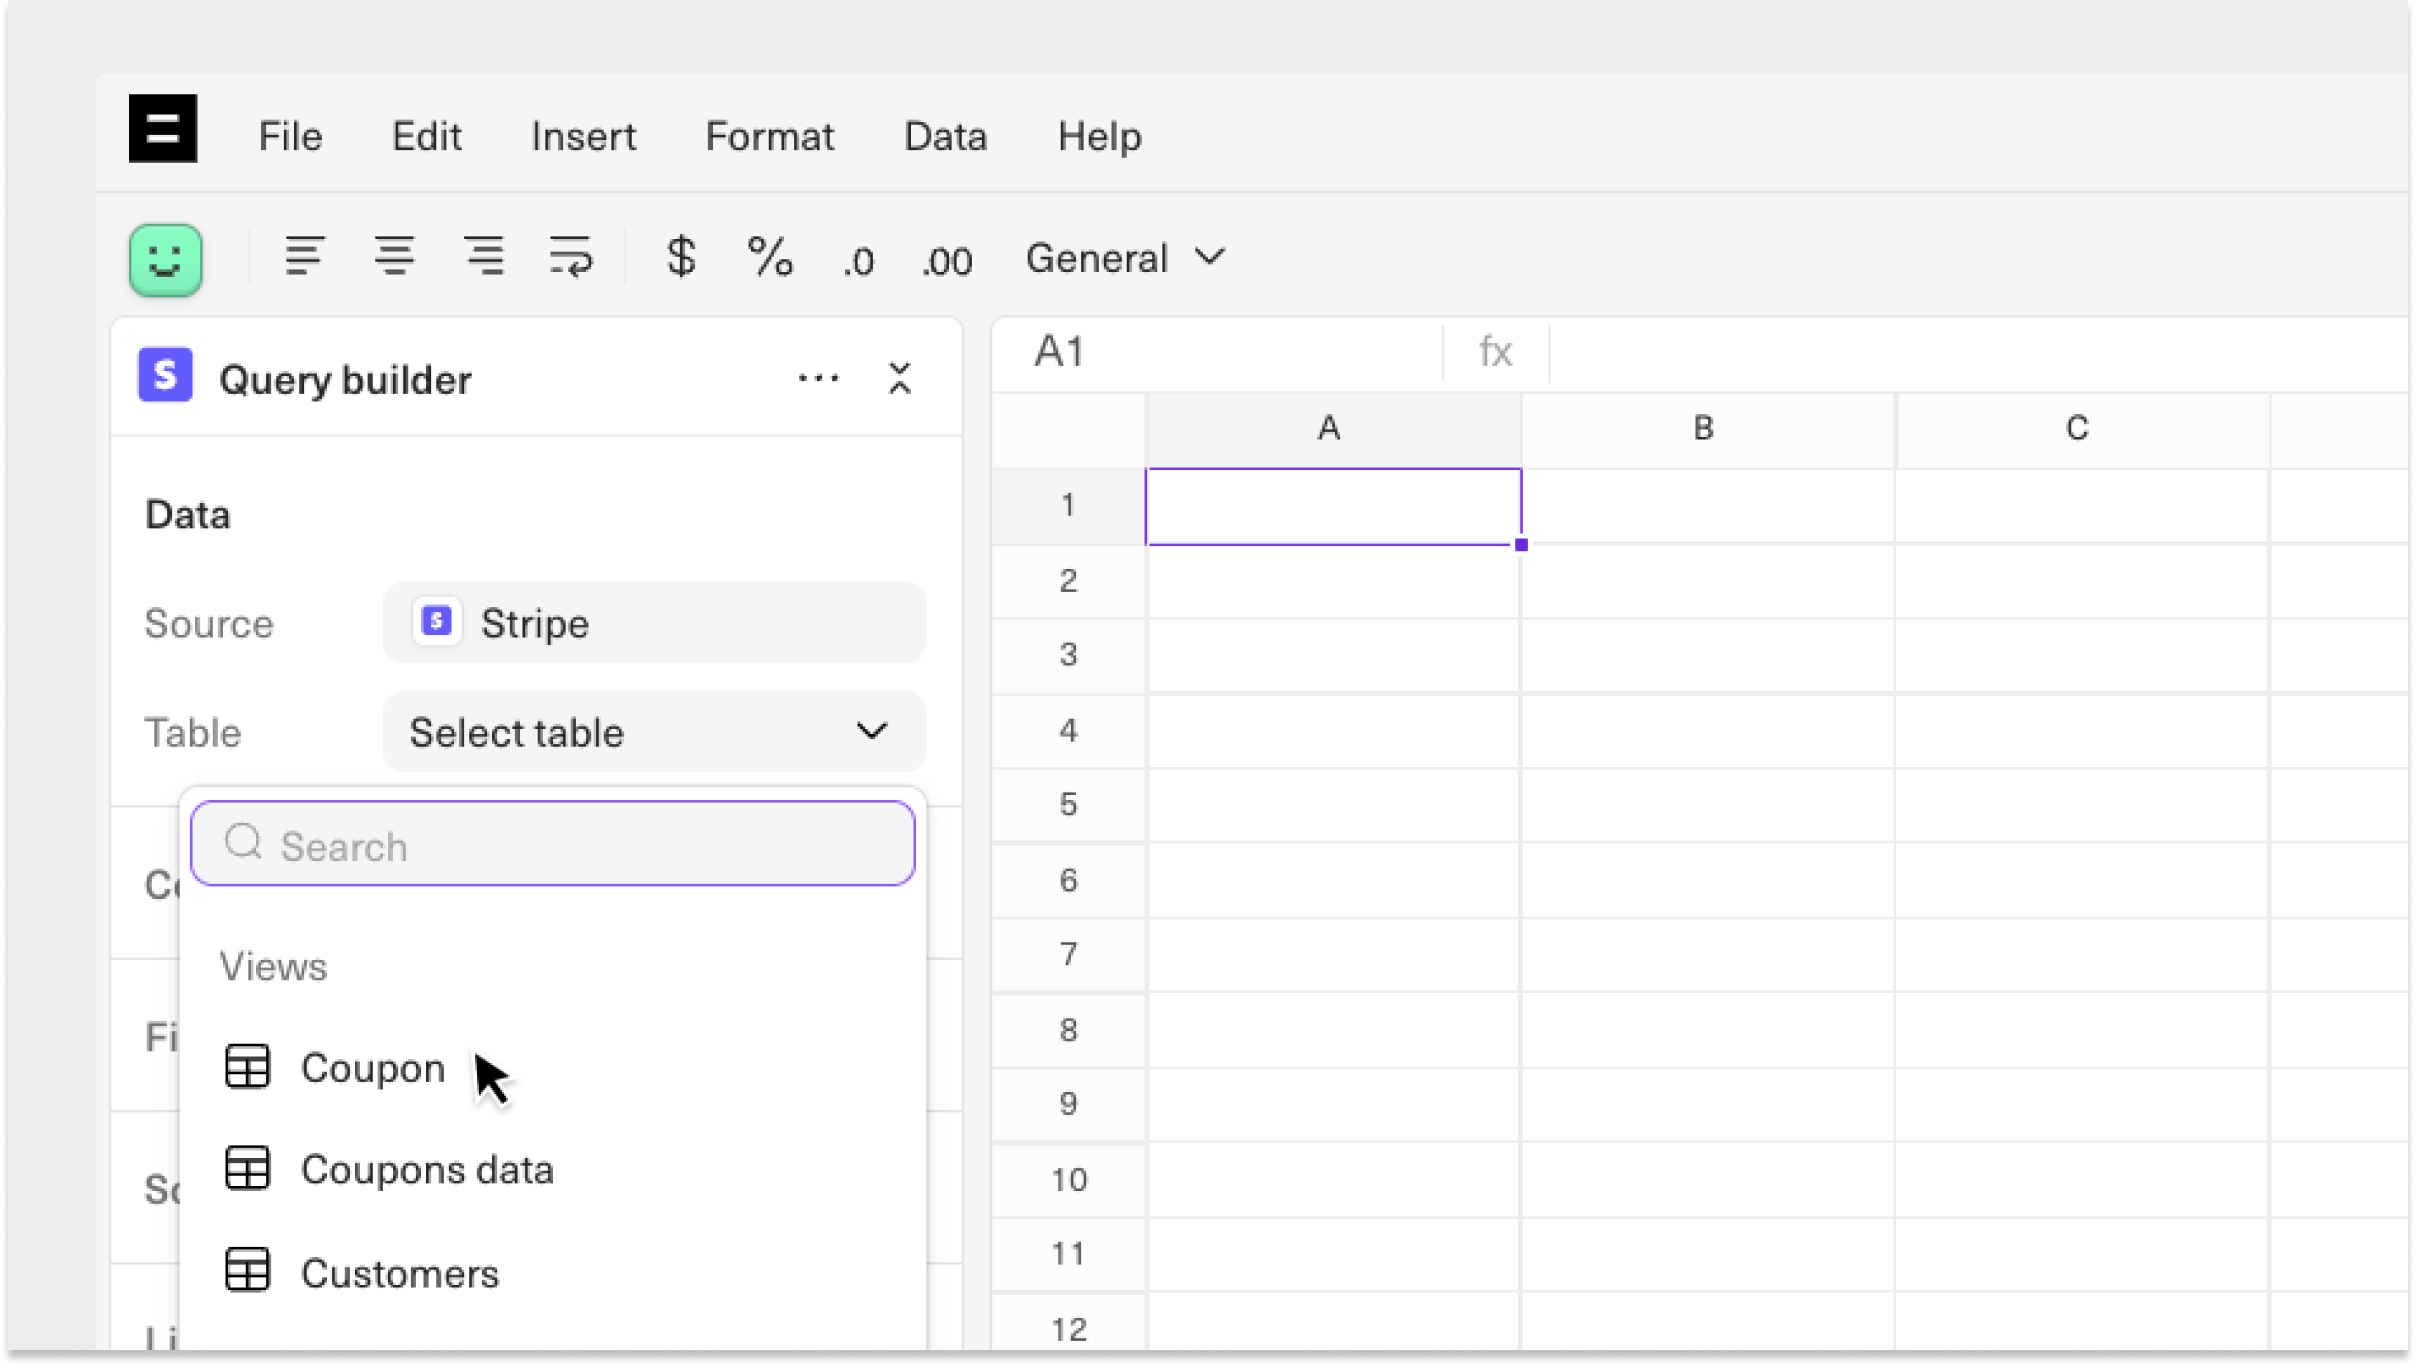
New datasource in the top right corner of the page and follow the instructions (or check out our configuration guides).
Workbooks
Equals workbooks are working files for your analyses and reports. They contain sheets that have all the spreadsheet fundamentals, including functions, shortcuts, pivot tables, and charts. You can also ask AI Assist for help building and refining your analysis. When you create a new workbook, you can choose to create either a regular or connected sheet.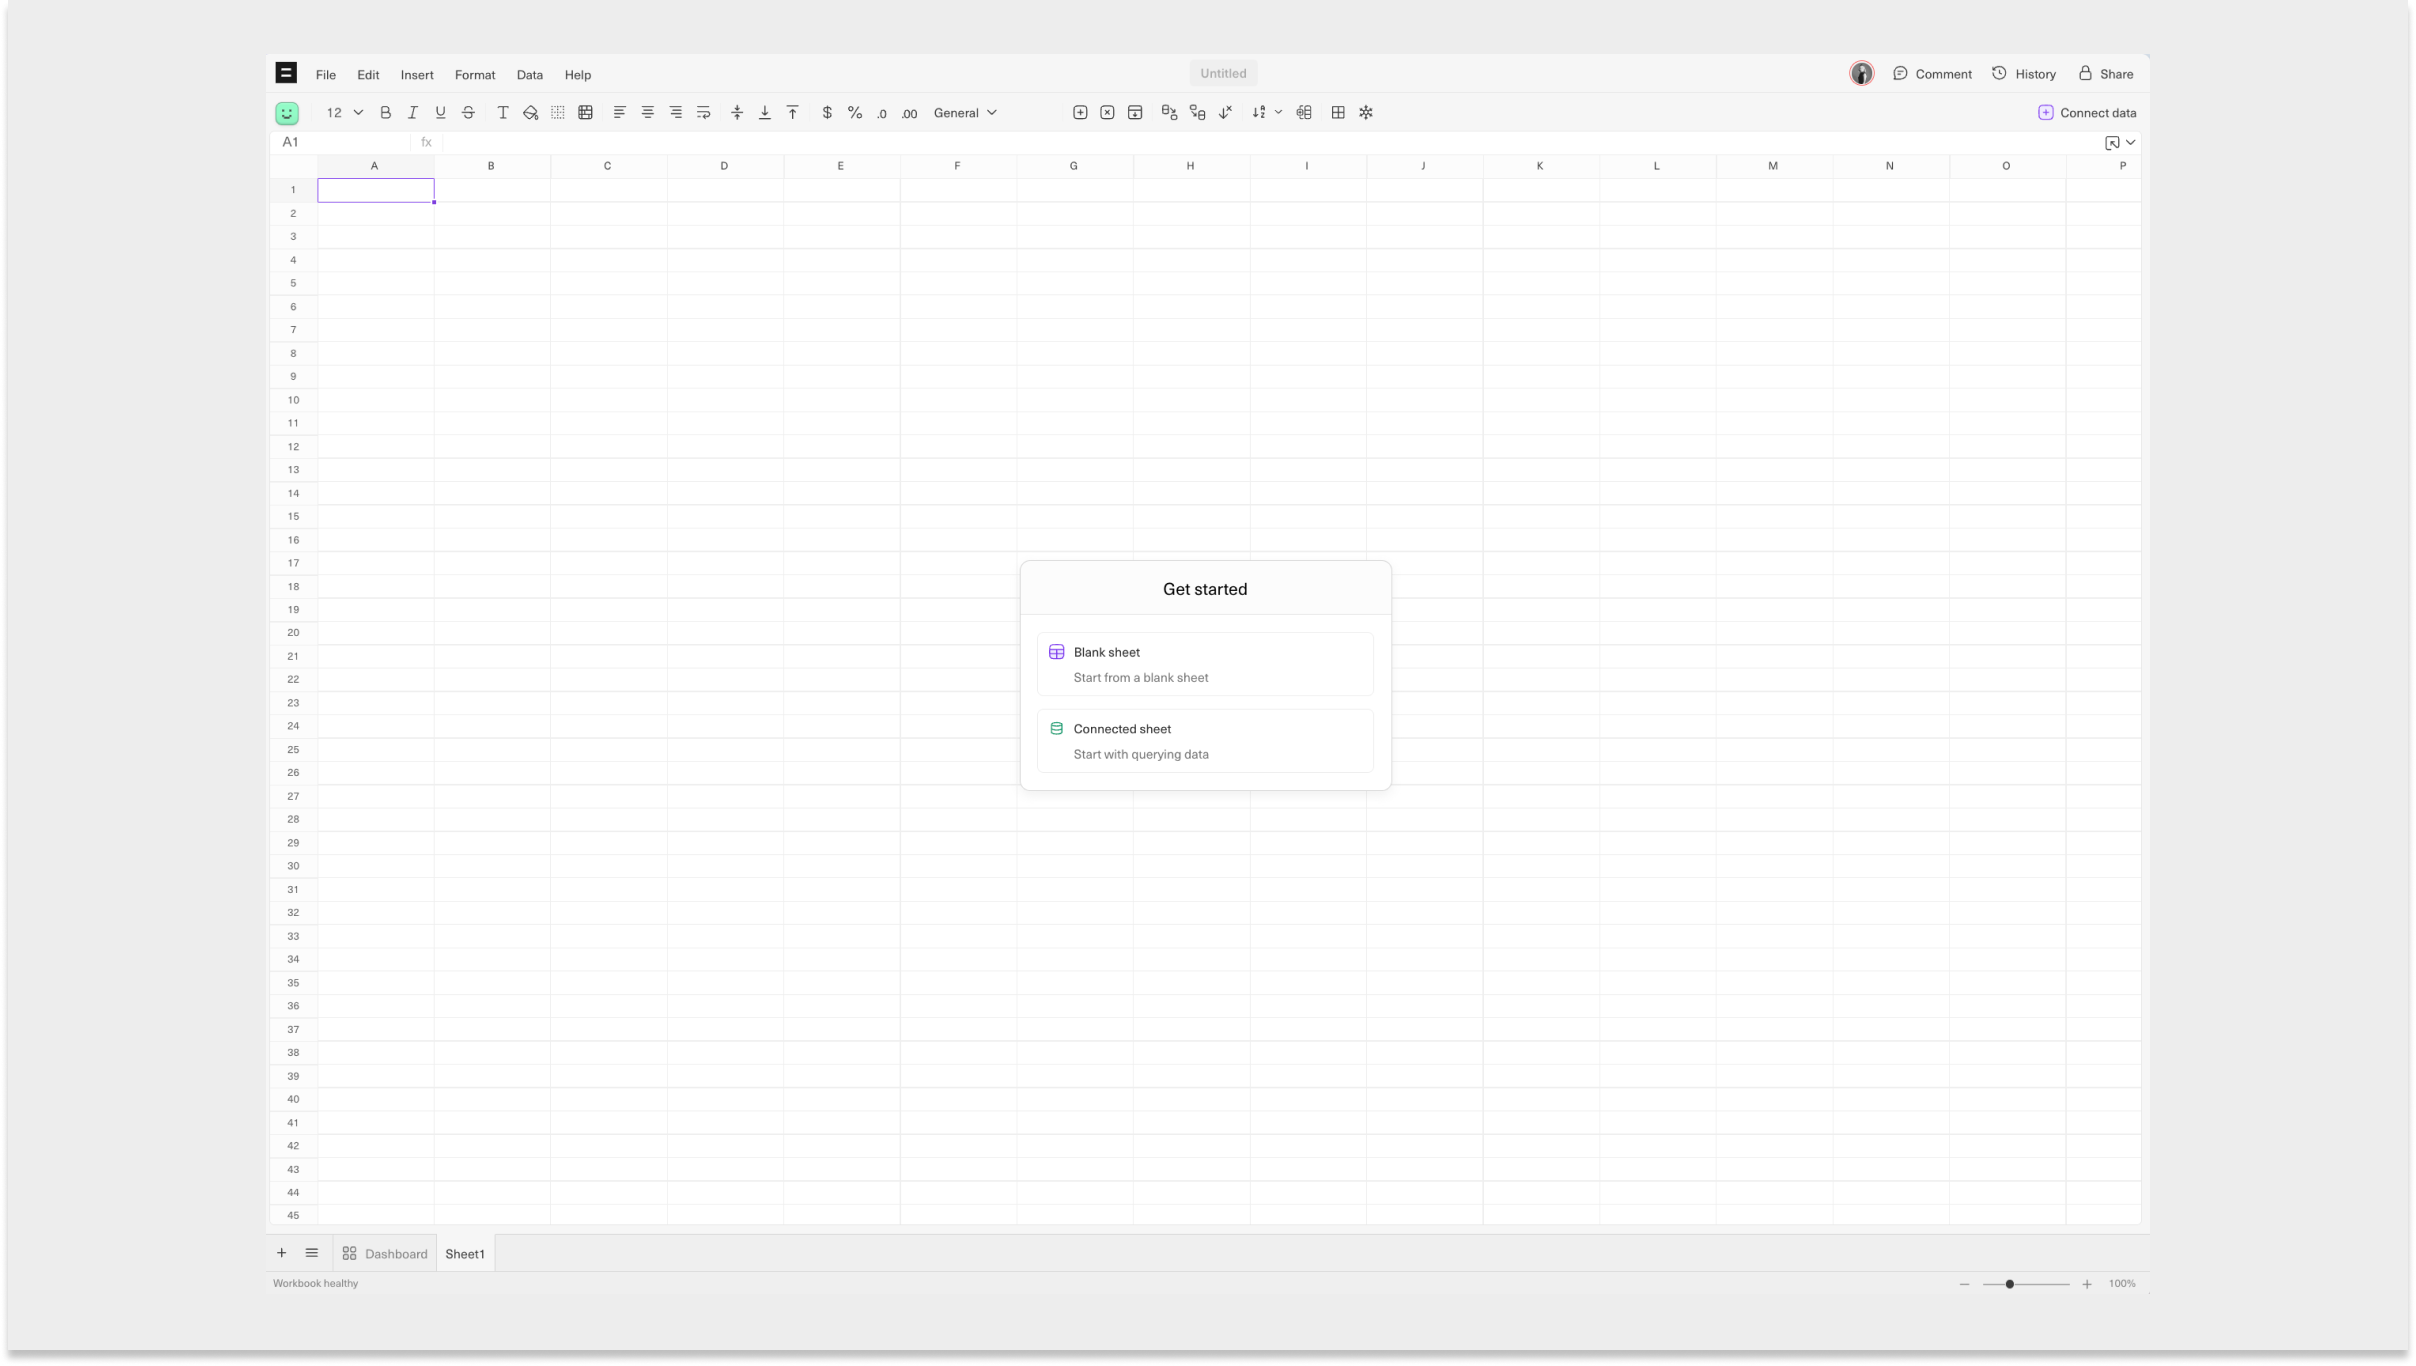
Dashboards
Every Equals workbook includes a dashboard, which allows you to transform your analysis into a live, board-ready report. Equals dashboards can be auto-distributed to Slack or email on a custom schedule.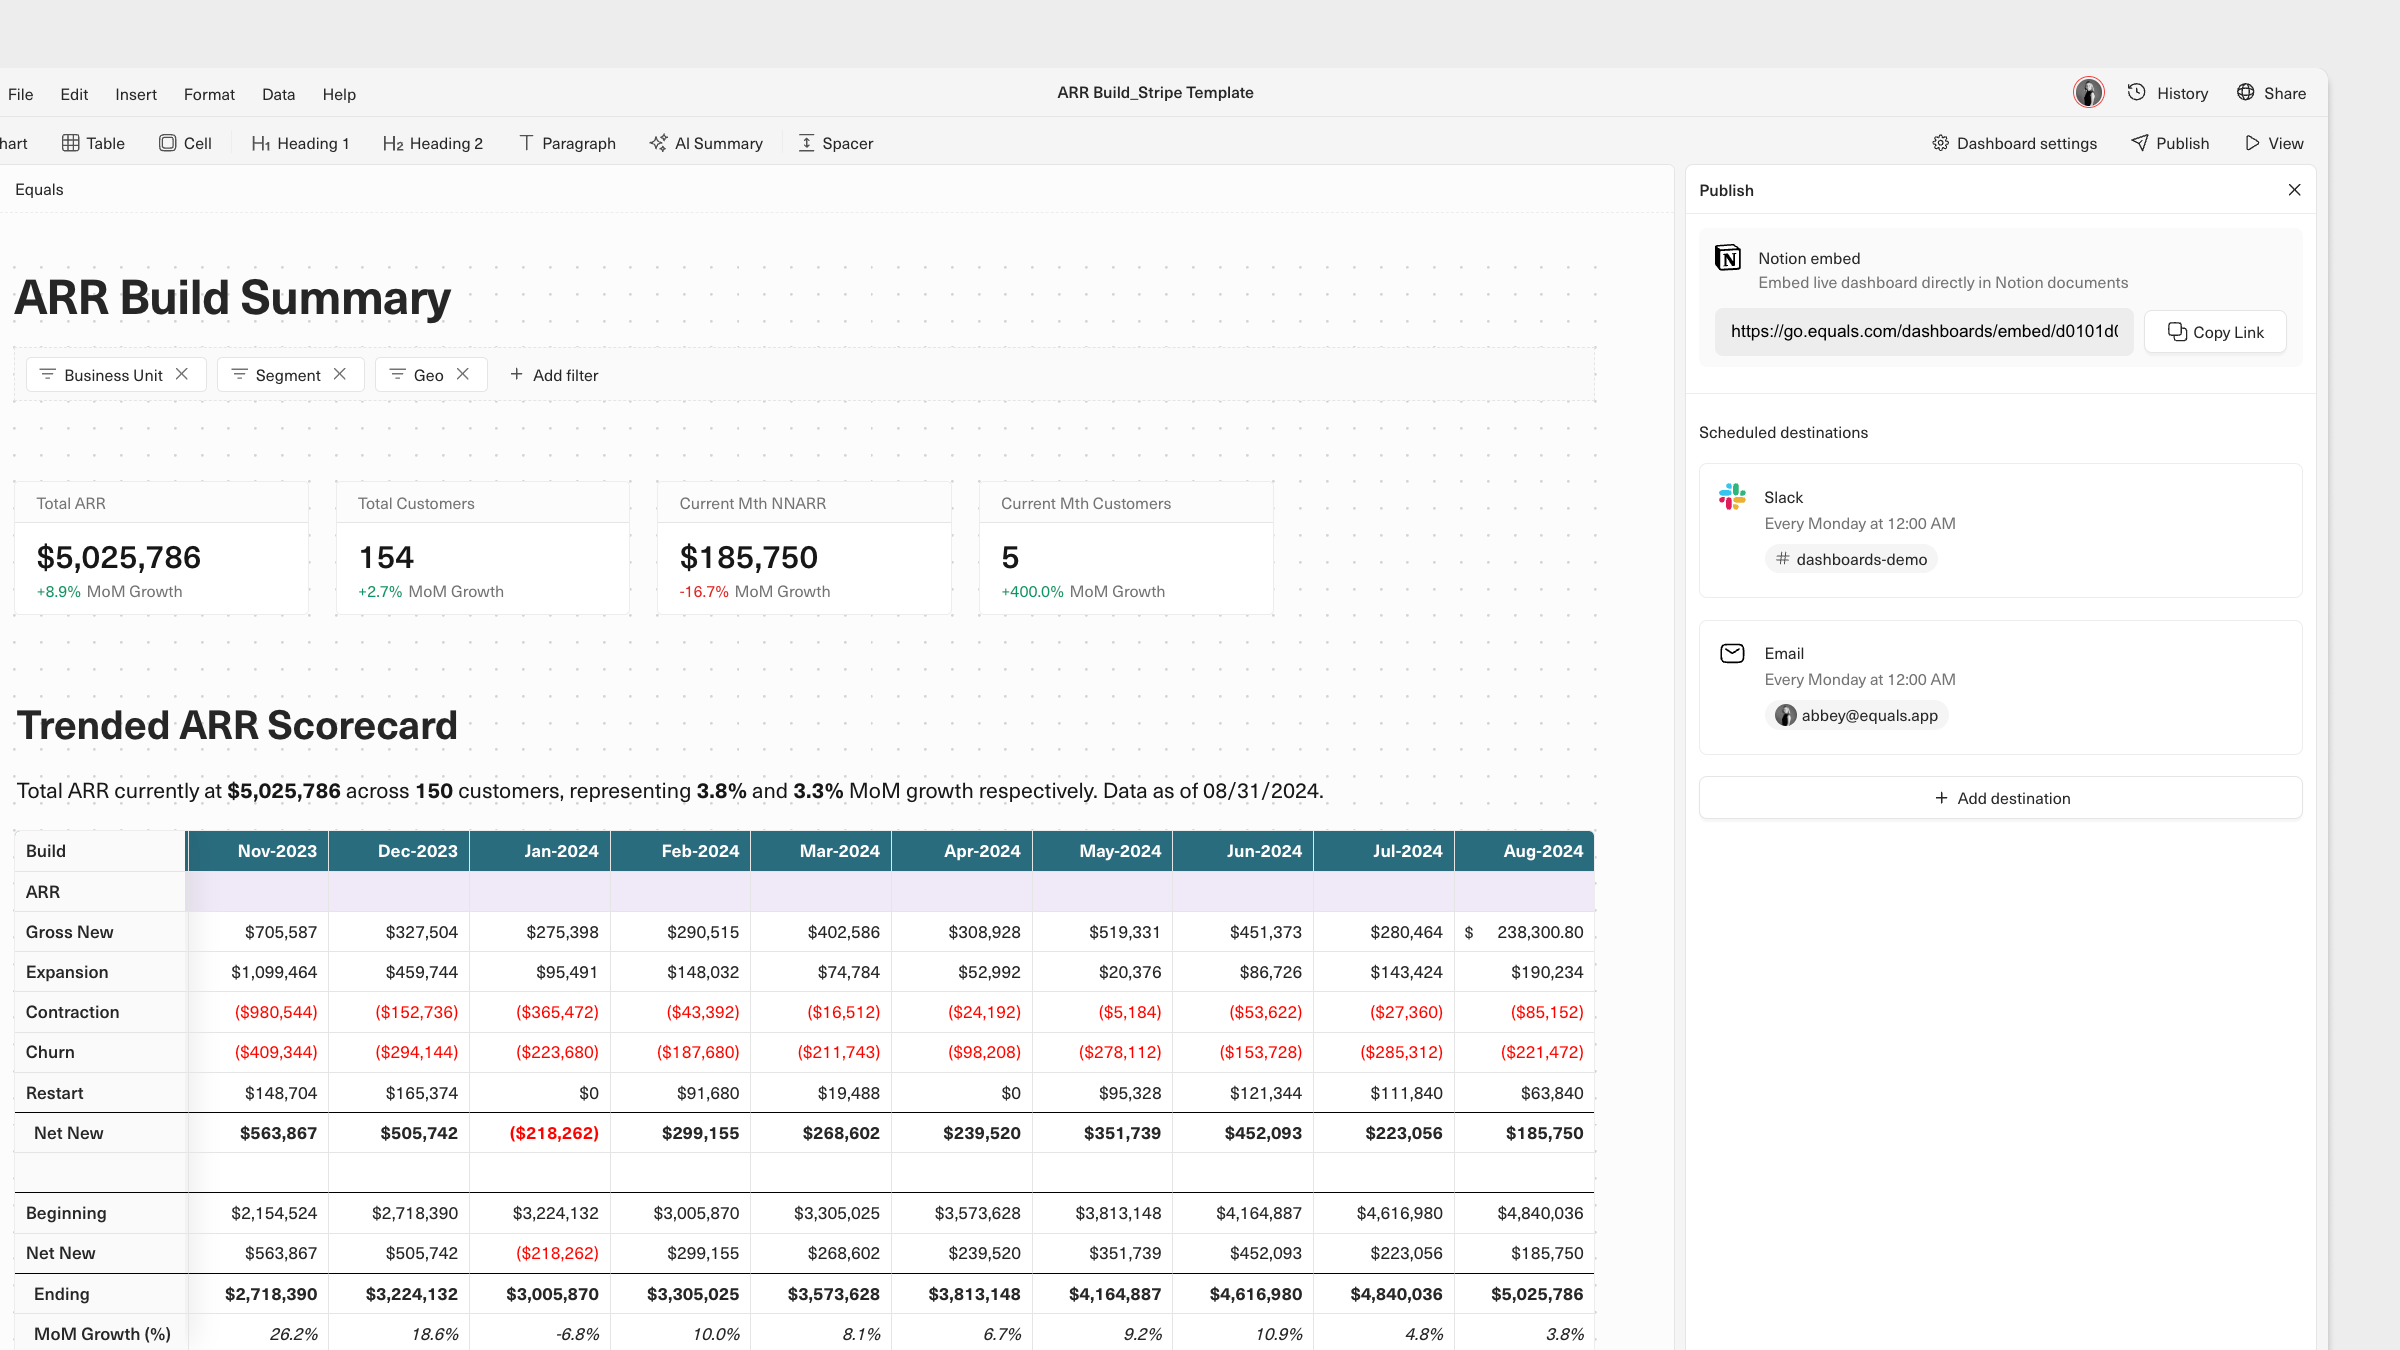
Transform data
Views
With views, you can use SQL to transform and join raw data from connected datasources into clean and analysis-ready tables. Once saved, Views sync to your data schema in your Equals Warehouse and can be directly queried from any workbook for analysis and reporting. Views are a great way to ensure consistency in how metrics and datasets are defined across your team.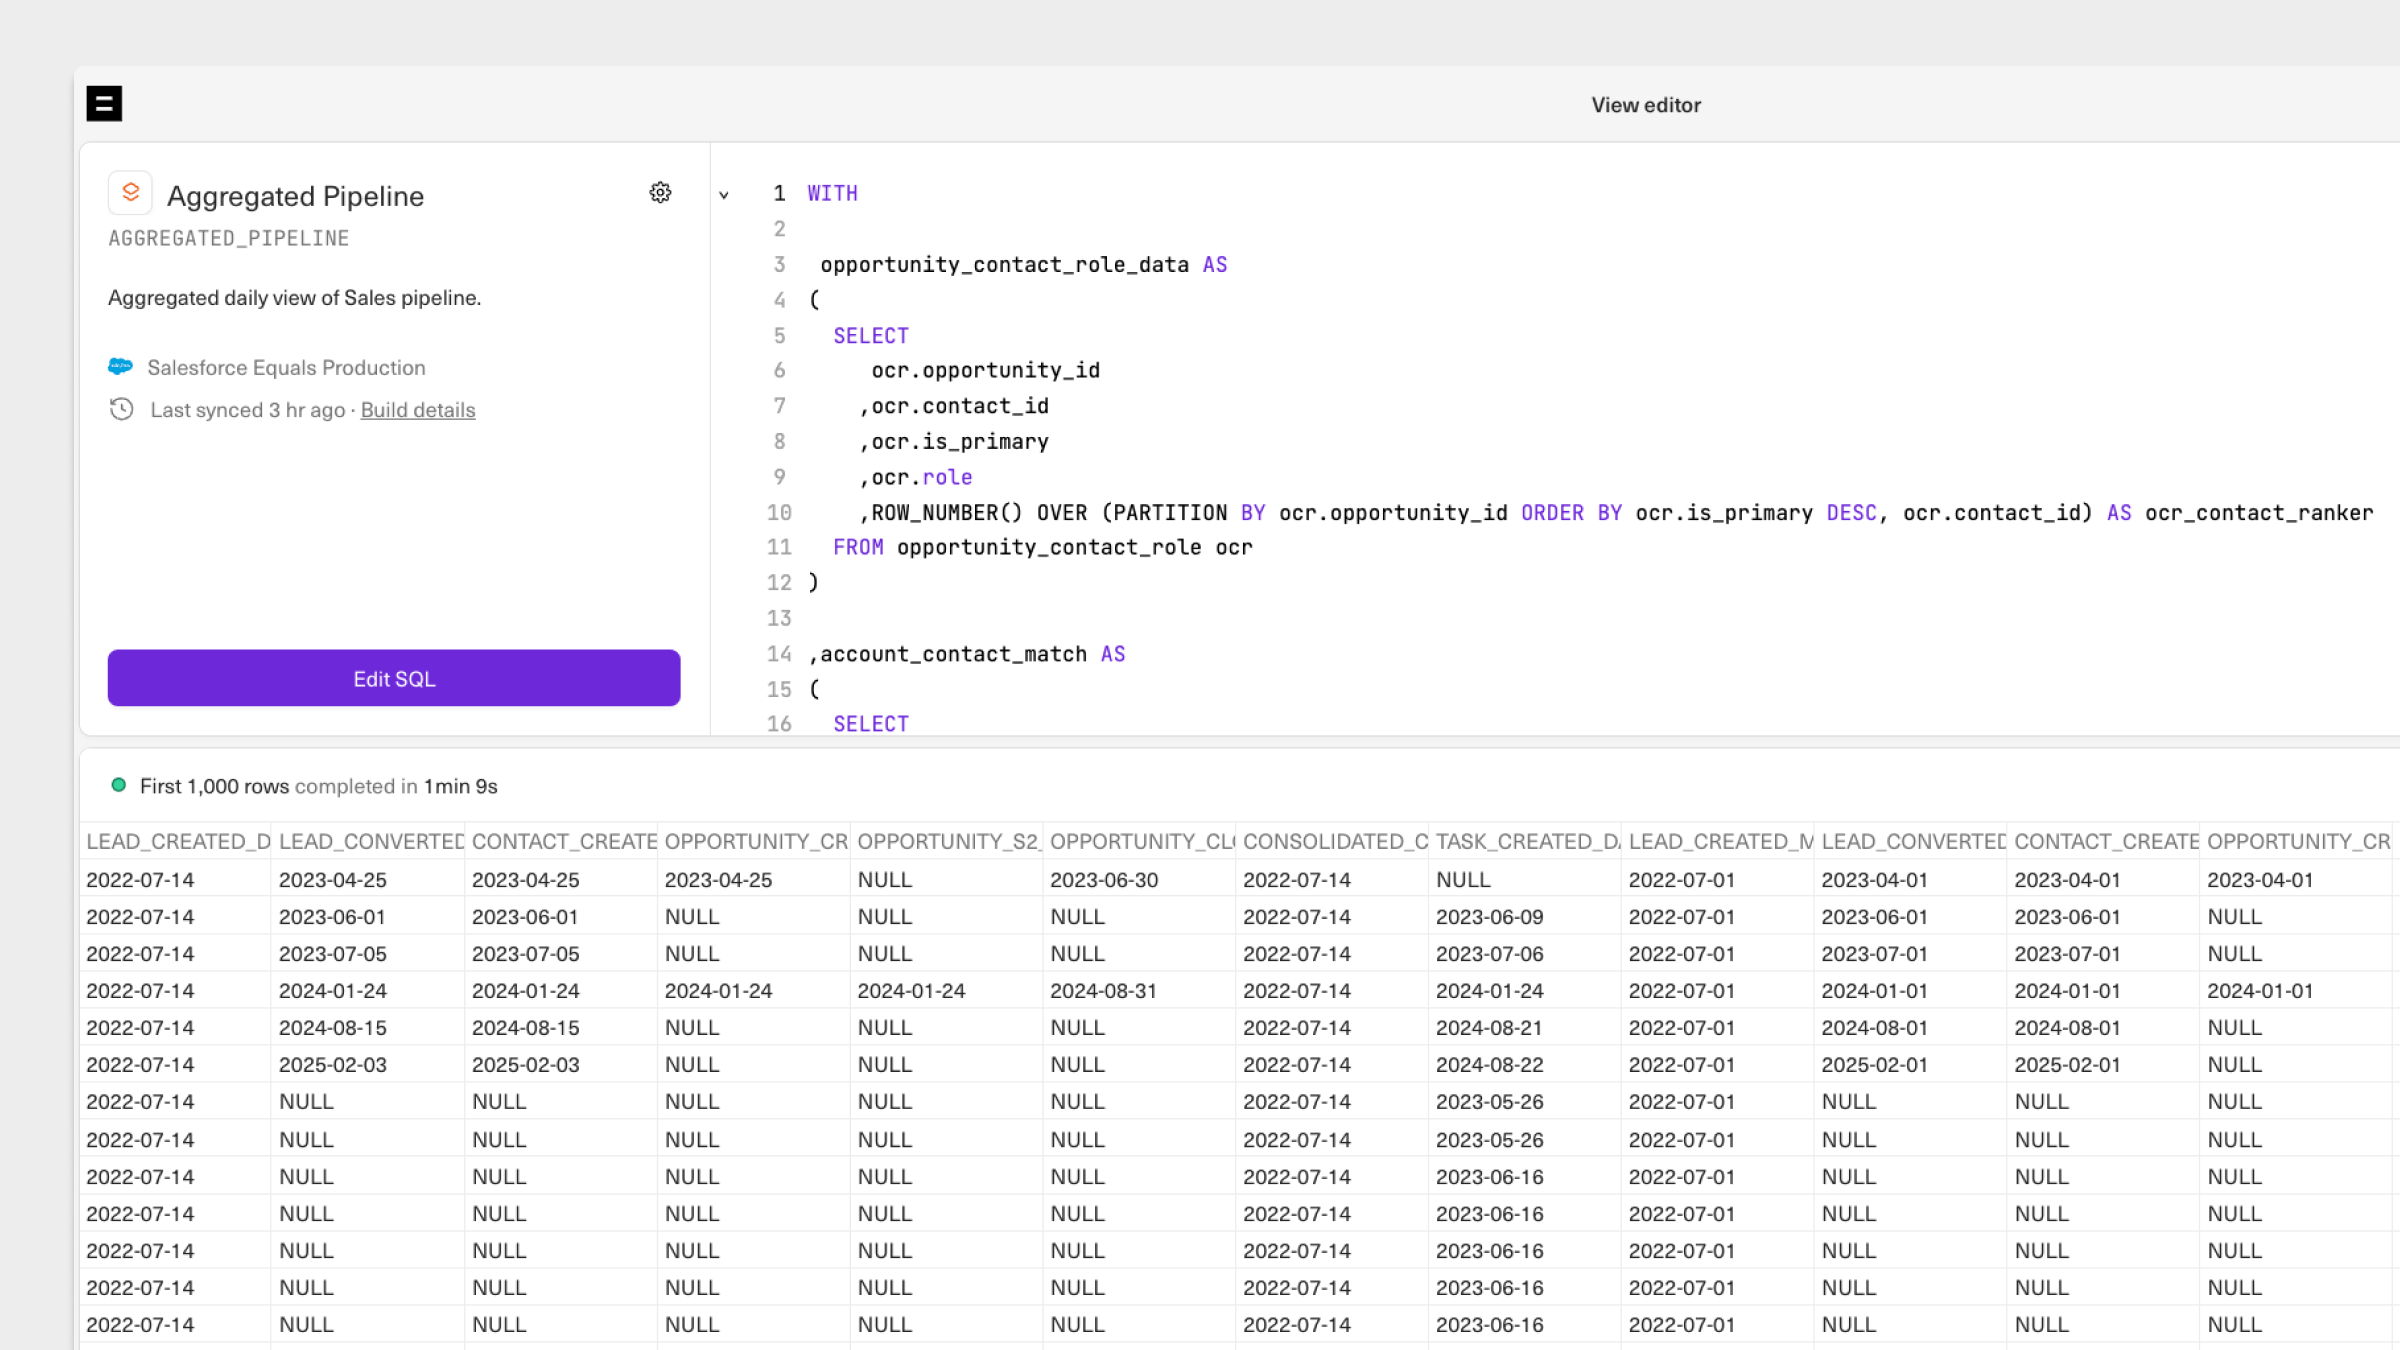
Explore data
SQL editor
Equals’ full-featured SQL editor allows you to write and run a traditional SQL query directly from any Equals workbook. To get started, first configure a datasource for your workspace. Then, click the Connect to datas in the top right corner of any workbook, select the datasource you’d like to query, and then select the SQL editor.Query builder
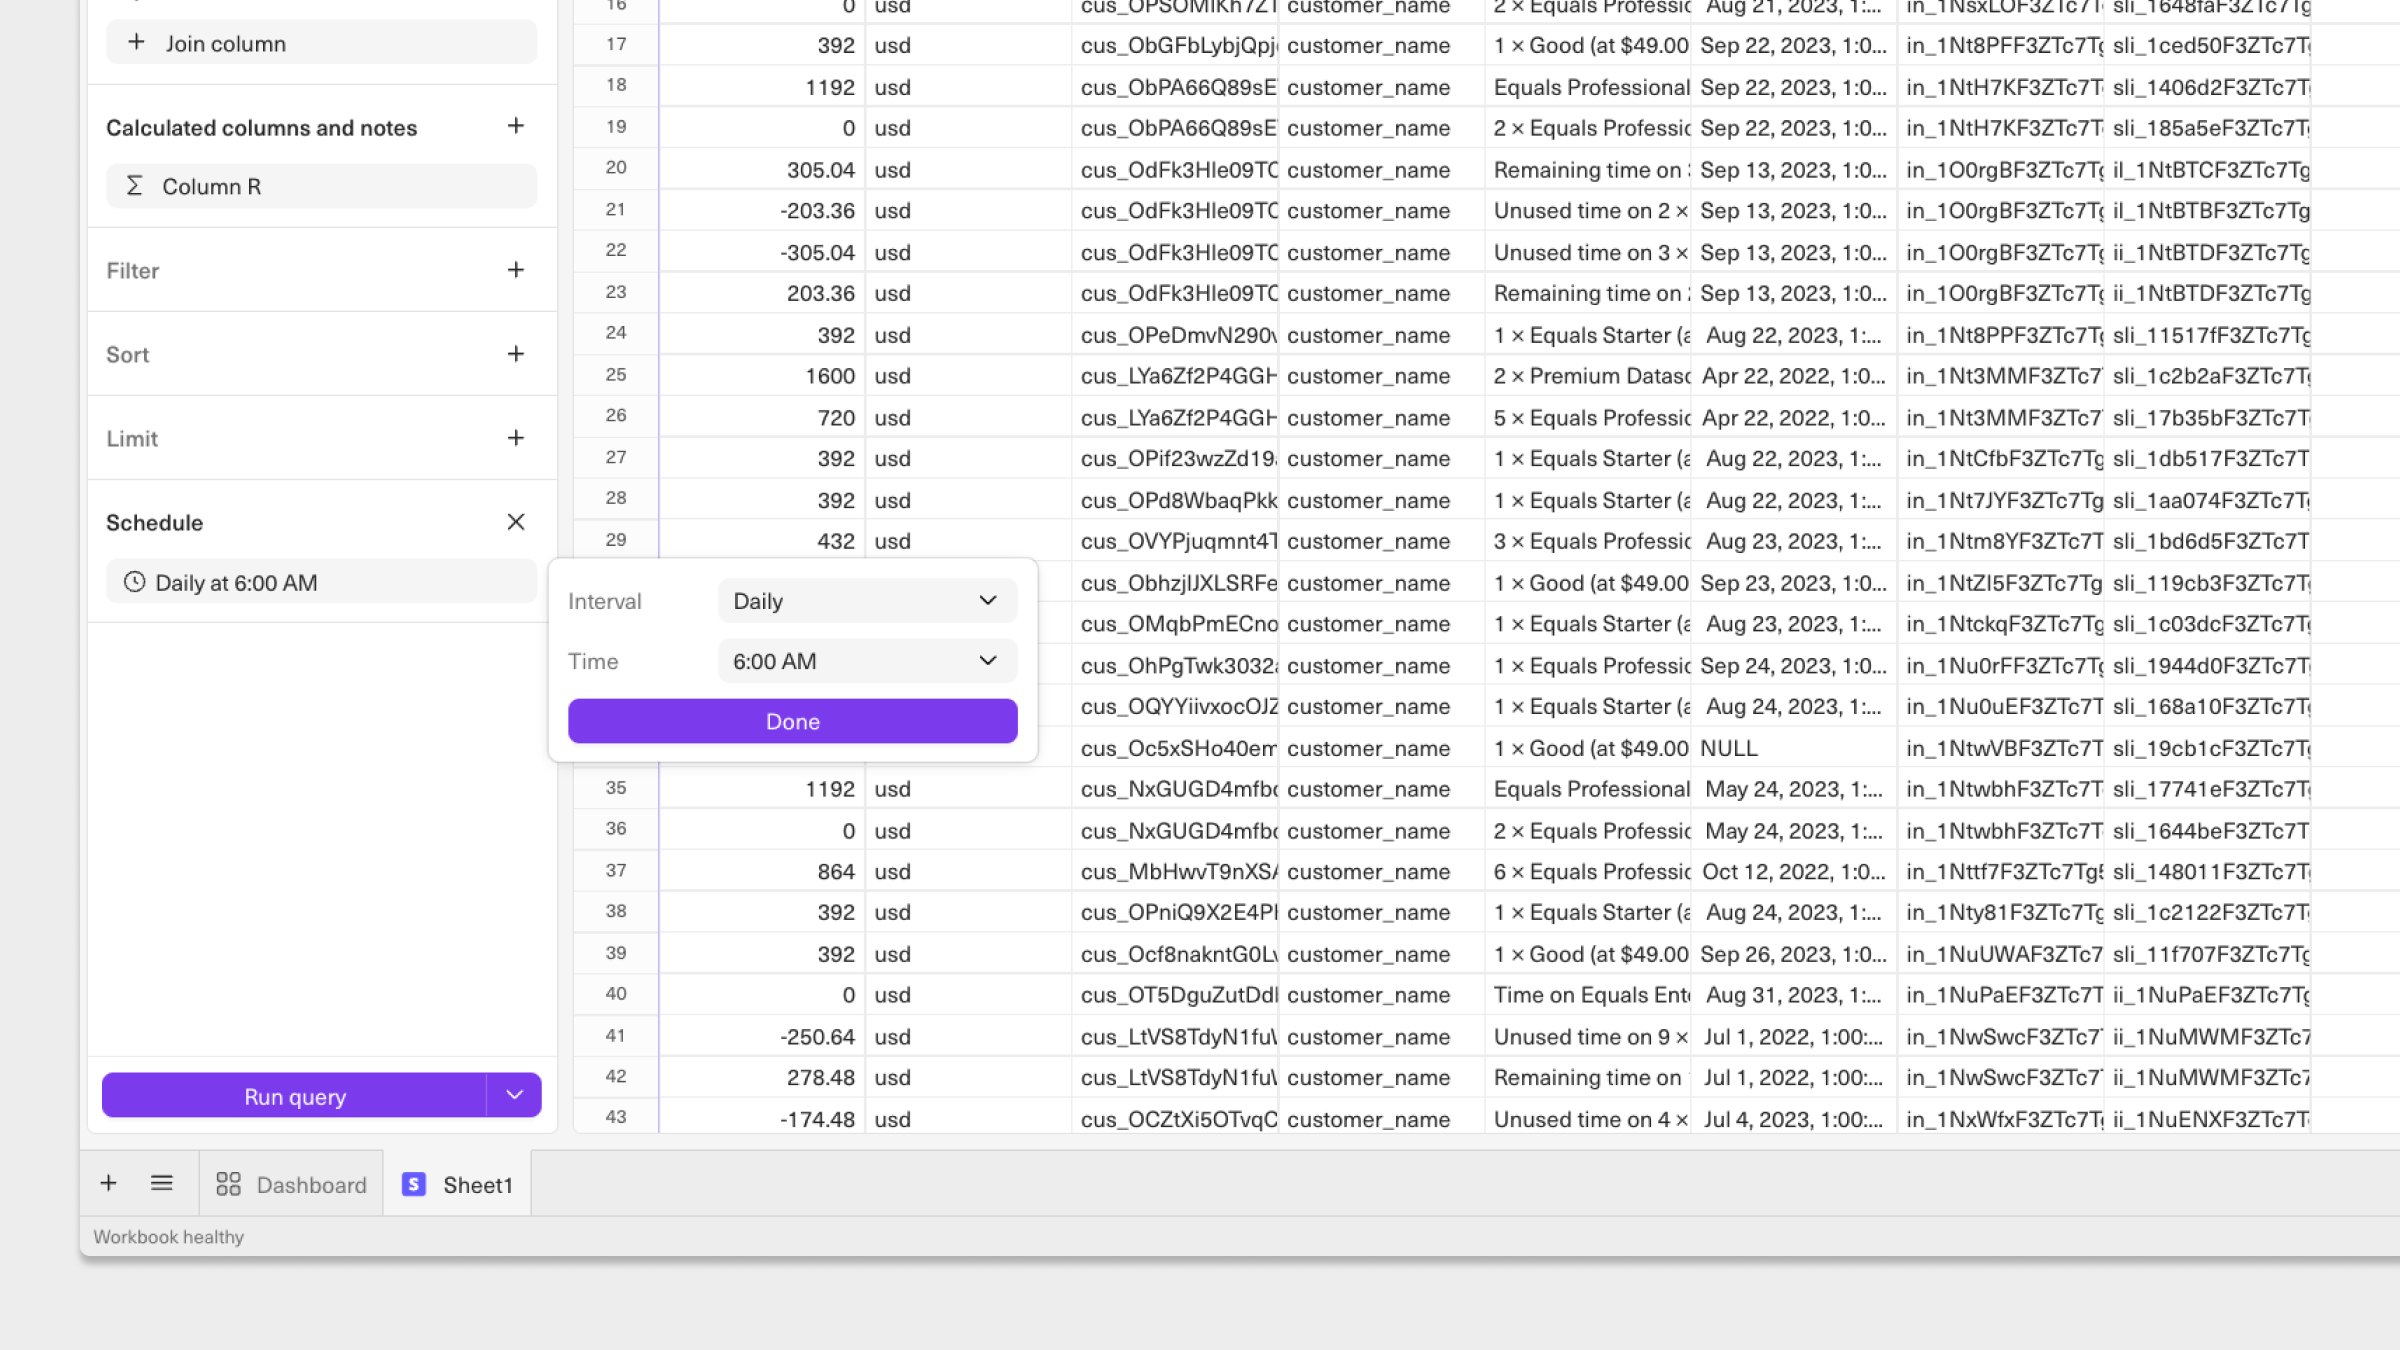
If you don’t know SQL, you can still query any supported datasource using the drag-and-drop query builder. The query builder supports common SQL statements such as joins and sorts. Queries built using the query builder can be converted to a traditional SQL query at any time by switching from the query builder to the SQL editor. To get started, first configure a datasource for your workspace. Then, click Connect to data in the top right corner of any workbook, select the datasource you’d like to query, and then select the query builder.Scheduling queries
With query scheduling you can automatically pull new data into your workbook either once an hour, day or week. When the scheduled query runs it will update all formulas that depend on the updated data. To schedule a query, click Settings next to the Run query button at the top right of a connected sheet.Import scripts
Beyond supported datasources, import scripts can be used to build custom integrations by pulling in data from third-party APIs. Import scripts can be written using either Javascript (Node 16) or Python (3.9). As a starting point, check out example import scripts for datasources like Airtable, Typeform, Github and more.Views
With views, you can transform raw data from any datasource into a simpler, analysis-ready table. Once saved, views sync to your underlying data schema and can be directly queried from any workbook for further analysis. Views are great for ensuring consistency in how metrics are defined and tracked - define them once, then use them anywhere.Restoring queries
With query version history, Equals keeps a copy of every query and the resulting data returned from the query to facilitate tracking and restoring changes. To restore any query run and its associated data, click History at the top right of the SQL editor or query builder, navigate to the version of your query you’d like to restore, and then hit Restore. To restore the query without changing the associated output data, select Restore query only.Saved queries
Saved queries enable workspace members to share commonly-used queries. Changes to a saved query will automatically update across all workbooks in which that saved query is used, ensuring that data is pulled consistently across multiple analyses. Saved queries can only be accessed by workspace members who have access to the underlying datasource. Saved queries can also be shared with the entire workspace or individual users on aView only or Can edit basis.
Analyze data
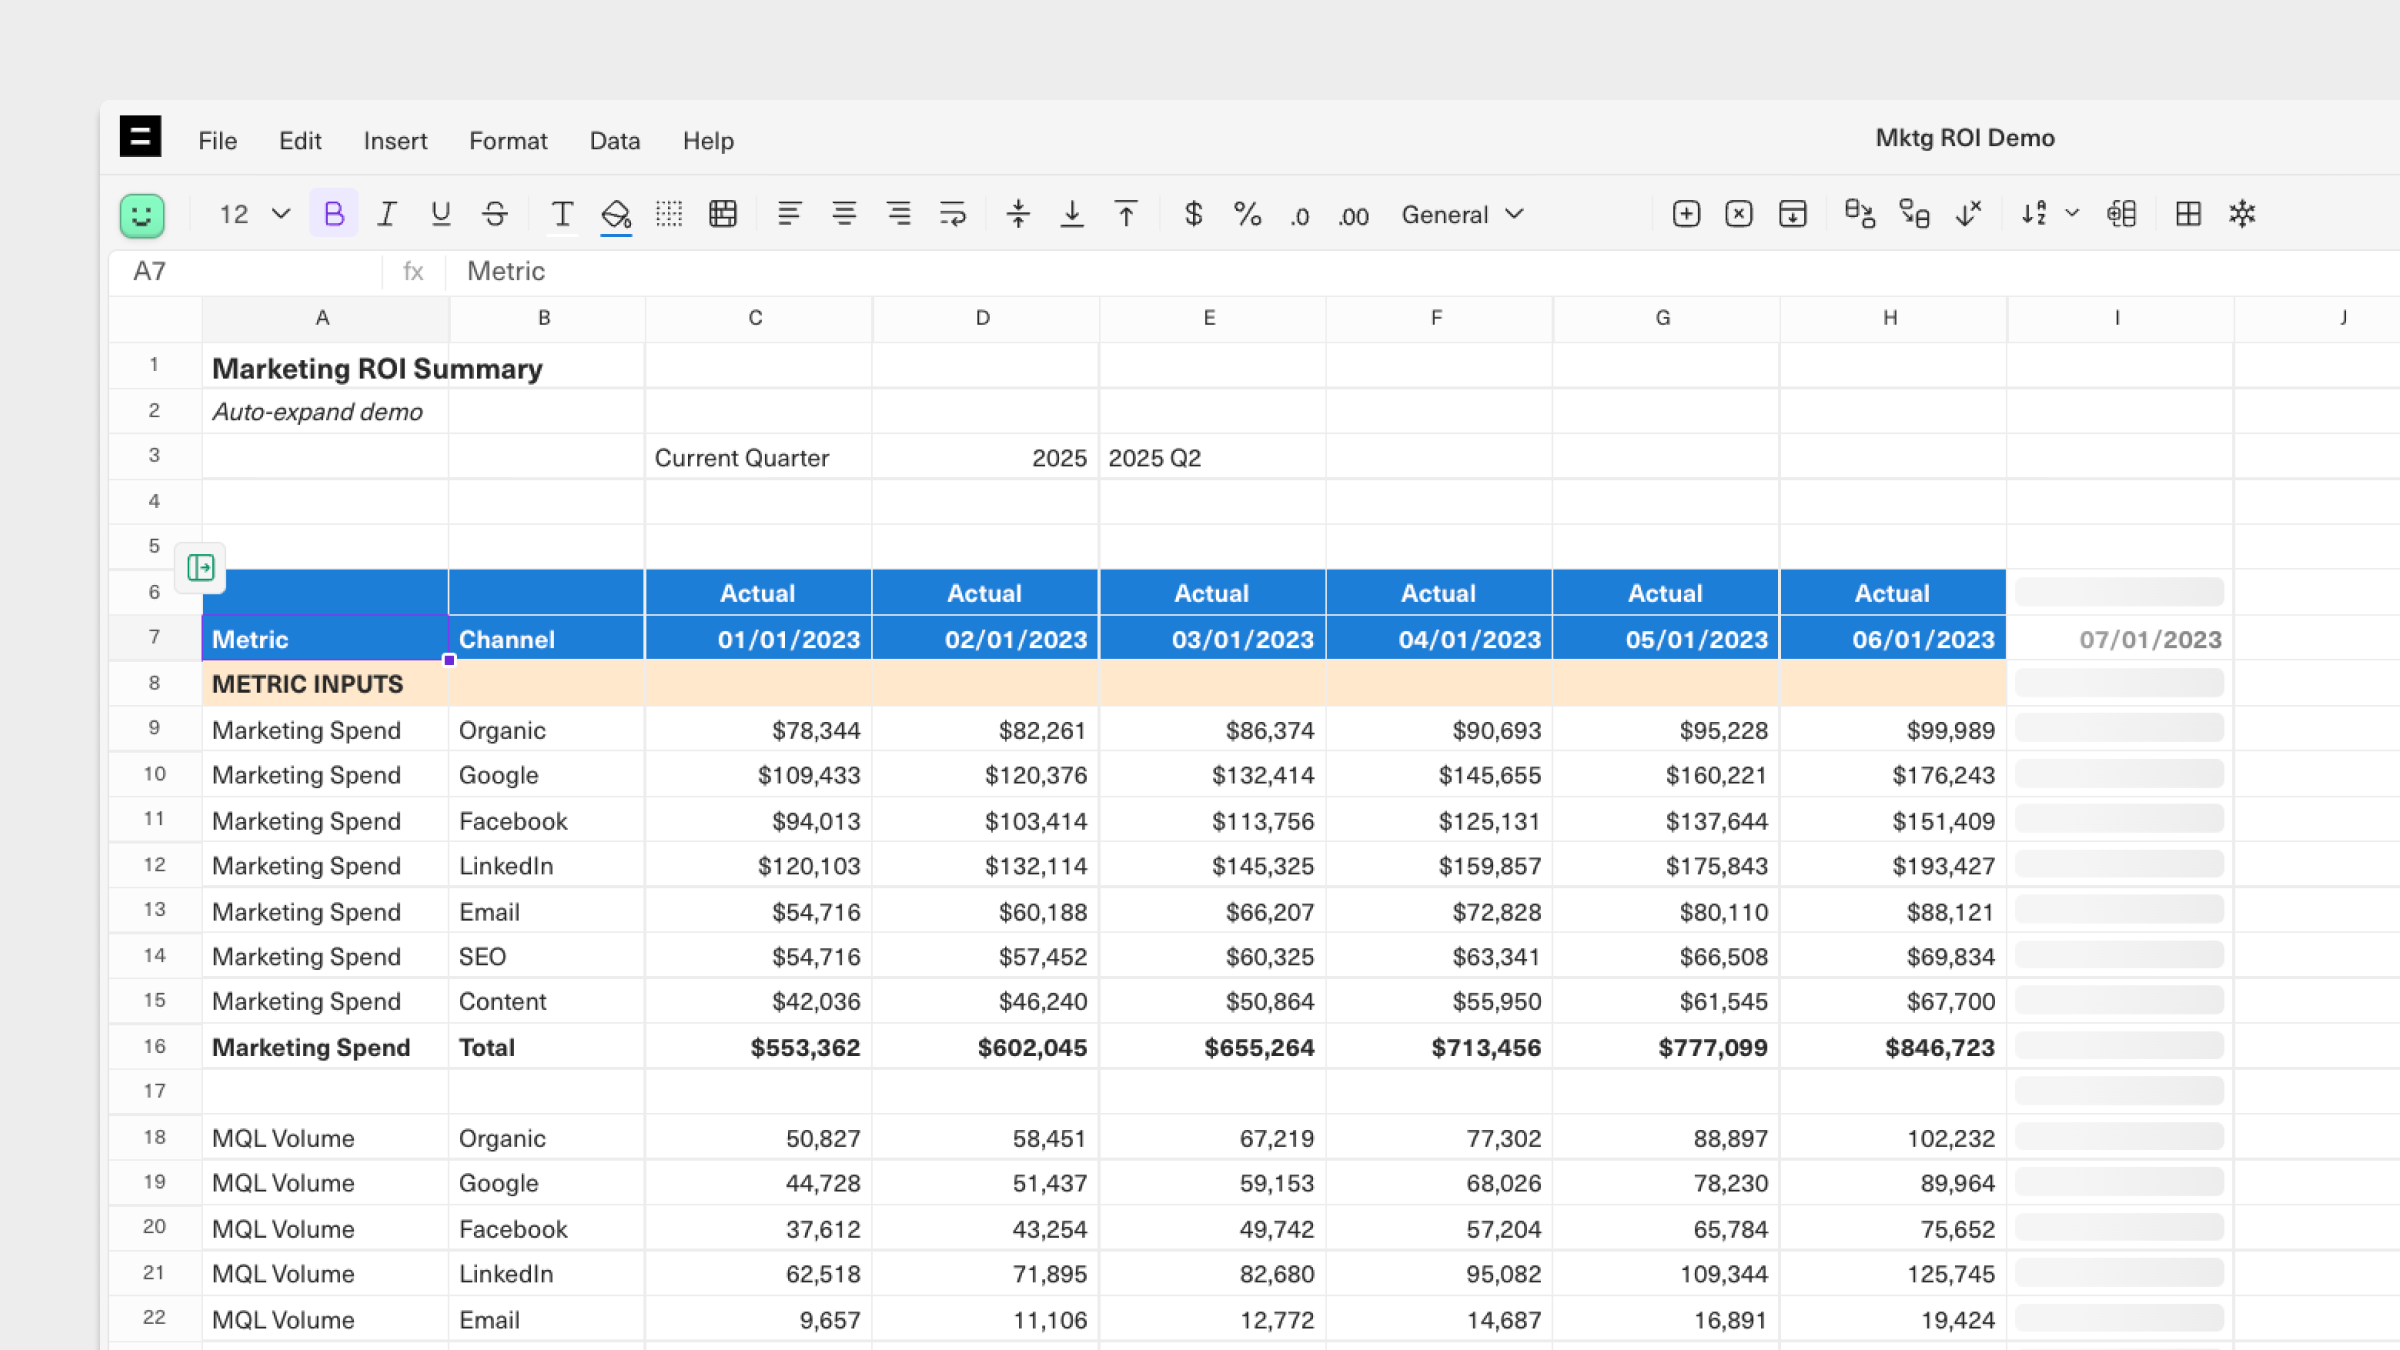
Auto-expand
With auto-expand, you can configure analyses (tables, charts, and pivot tables) to automatically refresh and expand (or contract) with each query run. This is useful for ensuring that analyses are up-to-date without the need to manually copy & paste data or expand ranges on your charts and tables.Calculated columns
With calculated columns, you can attach columns to data in a connected sheet that expand and contract with each query run. This is useful for automating transformations you must apply to queried data before using it in analysis, such as extracting dates or summing the value of multiple columns. To create a calculated column, enter a formula in a column directly adjacent to your queried data. The formula will auto-fill to the length of the column and stay up-to-date with each query run, eliminating the need to copy and paste formulas manually.Keyboard shortcuts
Your keyboard is the fastest way to edit your Equals workbook. Equals supports the full range of spreadsheet shortcuts you would expect coming from Excel or Google Sheets. These are a few of the most helpful:Cmd/Ctrl + Z to Undo Cmd/Ctrl + Y to Redo F4 to toggle cell locks Ctrl + Space to select column Shift + Space to select row option (Mac) or Shift + Alt (Windows) to enter alt mode
Command bar
Equals has a built-in command bar that allows you to easily discover and access any workbook command (and AI Assist) with a single keyboard shortcut. These include all commands related to workbook formatting, navigation, editing, and sorting/filtering. x PressCmd/Ctrl+K to open the command bar. From there, start typing in any command to get auto-complete suggestions. You can also enter a custom prompt for AI Assist or select a suggested prompt.
AI Assist
Powered by Open AI’s GPT-4 Turbo, AI Assist can help you write, edit, and fix SQL queries, formulas, charts, and more directly from your Equals workbook. You can ask AI Assist for help with anything in your workbook — AI Assist will also automatically detect and surface fixes for errors in your queries and formulas. Just hitCmd/Ctrl + J to chat with AI Assist, or Cmd/Ctrl+K to open AI Assist from the command bar.
Report on data
Distributed reports
You can send dashboards to Slack and email on a custom schedule. Dashboards are sent as snapshots, showing the most recent view of tables, charts, and cells. Scheduling query runs and dashboard sends will ensure your dashboard is refreshed and distributed to stakeholders on a cadence that works for your team.What’s Next